


Investor centre.
Net sales and net income, 2021–2025.
Hover or tap a year for the full figures.
Financial statements, 2021–2025.
Figures in Rp million, except outstanding shares (full amount), net income per share (Rp), and ratios. Amounts in brackets are expenses.
| Rp million | 2025 | 2024 | 2023 | 2022 | 2021 |
|---|---|---|---|---|---|
| Income statement | |||||
| Net sales | 2,726,974 | 1,956,431 | 1,525,445 | 1,290,992 | 935,075 |
| Cost of goods sold | (1,296,477) | (950,220) | (714,509) | (620,240) | (435,507) |
| Gross profit | 1,430,497 | 1,006,211 | 810,936 | 670,752 | 499,568 |
| Operating expenses | (544,827) | (376,573) | (326,243) | (218,215) | (171,347) |
| Operating income | 885,670 | 629,638 | 484,693 | 452,537 | 328,221 |
| Other income (expenses), net | 51,509 | 38,090 | 18,971 | 11,771 | 9,607 |
| Income before income tax | 937,179 | 667,728 | 503,664 | 464,308 | 337,828 |
| Net income | 741,580 | 527,368 | 395,798 | 364,972 | 265,758 |
| Attributable to the parent entity | 741,580 | 527,368 | 395,798 | 364,972 | 265,758 |
| Attributable to non-controlling interest | – | – | – | – | – |
| Total comprehensive income for the year | 742,202 | 528,693 | 394,972 | 365,019 | 269,309 |
| Attributable to the parent entity | 742,202 | 528,693 | 394,972 | 365,019 | 269,309 |
| Attributable to non-controlling interest | – | – | – | – | – |
| Per share & working capital | |||||
| Outstanding shares (full amount) | 589,896,800 | 589,896,800 | 589,896,800 | 589,896,800 | 589,896,800 |
| Net income per share (Rp) | 1,257 | 894 | 671 | 619 | 451 |
| Net working capital | 1,557,594 | 1,167,857 | 931,296 | 560,600 | 405,027 |
| Financial position | |||||
| Current assets | 2,070,722 | 1,551,646 | 1,230,110 | 815,319 | 673,394 |
| Fixed assets, net | 1,190,039 | 910,229 | 745,409 | 708,363 | 503,588 |
| Other non-current assets | 308,020 | 234,999 | 109,663 | 121,900 | 127,126 |
| Total assets | 3,568,781 | 2,696,874 | 2,085,182 | 1,645,582 | 1,304,108 |
| Current liabilities | 513,128 | 383,789 | 298,814 | 254,719 | 268,367 |
| Deferred tax liabilities, net | 15,364 | 15,160 | 17,652 | 19,995 | 21,999 |
| Other non-current liabilities | 39,586 | 39,424 | 38,908 | 36,032 | 43,925 |
| Total liabilities | 568,078 | 438,373 | 355,374 | 310,746 | 334,291 |
| Total equity | 3,000,703 | 2,258,501 | 1,729,808 | 1,334,836 | 969,817 |
| Key ratios | |||||
| Net income to total assets | 21% | 20% | 19% | 22% | 20% |
| Net income to total equity | 25% | 23% | 23% | 27% | 27% |
| Current ratio | 4.04 | 4.04 | 4.12 | 3.20 | 2.51 |
| Total liabilities to total equity | 0.19 | 0.19 | 0.21 | 0.23 | 0.34 |
| Total liabilities to total assets | 0.16 | 0.16 | 0.17 | 0.19 | 0.26 |
| Gross profit to net sales | 52% | 51% | 53% | 52% | 53% |
| Operating income to net sales | 32% | 32% | 32% | 35% | 35% |
| Net income to net sales | 27% | 27% | 26% | 28% | 28% |
Capitalization & shares.
ADES has been listed on the Indonesia Stock Exchange since 31 March 1994, with a par value of Rp 1,000 per share.
- Day range
- 31,550 – 33,500
- 52-week range
- 13,525 – 40,000
- Volume
- 160,200shares
- Avg. volume (3 months)
- 36,483shares
- Market capitalisation
- Rp 19.39trillion
- P/E (EPS 2025)
- 26.2×
- Year to date
- +113.1%
- All-time high
- Rp 40,000Jul 2026
Price history
| Date | Open | High | Low | Close | Change | Volume |
|---|---|---|---|---|---|---|
| 20 Oct 2026 | 31,775 | 33,500 | 31,550 | 32,875 | 0.0% | 160,200 |
| 19 Oct 2026 | 32,550 | 33,375 | 31,825 | 32,875 | −3.9% | 295,600 |
| 16 Oct 2026 | 34,000 | 35,000 | 31,800 | 34,200 | −0.1% | 105,600 |
| 15 Oct 2026 | 35,000 | 35,000 | 34,000 | 34,250 | −1.5% | 26,000 |
| 14 Oct 2026 | 35,700 | 35,700 | 34,775 | 34,775 | −2.3% | 16,100 |
| 13 Oct 2026 | 34,000 | 35,600 | 33,300 | 35,600 | +4.2% | 53,900 |
| 12 Oct 2026 | 34,650 | 34,775 | 33,975 | 34,150 | −1.9% | 15,700 |
| 9 Oct 2026 | 34,850 | 34,850 | 34,000 | 34,825 | −0.1% | 15,000 |
| 8 Oct 2026 | 35,100 | 35,175 | 34,375 | 34,850 | −0.7% | 15,400 |
| 7 Oct 2026 | 35,150 | 35,225 | 34,475 | 35,100 | −0.1% | 11,400 |
| 6 Oct 2026 | 34,950 | 35,150 | 34,050 | 35,150 | +0.7% | 31,600 |
| 5 Oct 2026 | 35,525 | 35,525 | 34,725 | 34,900 | −2.0% | 15,200 |
| 2 Oct 2026 | 35,775 | 35,775 | 34,850 | 35,600 | −0.5% | 26,700 |
| 1 Oct 2026 | 36,000 | 36,000 | 35,200 | 35,775 | −0.6% | 10,100 |
| 30 Sept 2026 | 35,975 | 36,400 | 35,000 | 35,975 | +0.1% | 31,600 |
| 29 Sept 2026 | 36,650 | 36,650 | 35,000 | 35,950 | −1.9% | 48,200 |
| 28 Sept 2026 | 34,025 | 38,000 | 34,025 | 36,650 | +7.8% | 108,300 |
| 25 Sept 2026 | 34,775 | 34,775 | 34,000 | 34,000 | −2.6% | 8,900 |
| 24 Sept 2026 | 31,800 | 34,900 | 31,800 | 34,900 | +9.7% | 6,400 |
| 23 Sept 2026 | 31,750 | 31,800 | 31,750 | 31,800 | −0.5% | 30,000 |
Last 20 trading days.
Source: Yahoo Finance (ADES.JK), end-of-day prices from the Indonesia Stock Exchange; refreshed automatically several times a day. Volume in shares.
Dividend history.
Distribution recorded on the company's dividend page.
| Year | Total dividend | Shares | Per share |
|---|---|---|---|
| 1995 | Rp 760.000.000 | 38.000.000 | Rp 20 |
Financial statements.
Annual year-end statements and interim statements for each quarter, back to the 2012 financial year.
Show archive 2012–2023Hide archive
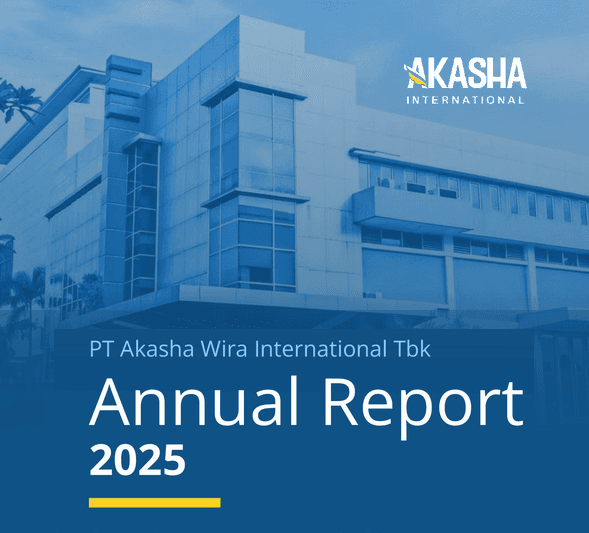







Sustainability reports.
Sustainability reports, 2021–2025.
Investor documents.
Summary of financial performance over the last five years.
Annual and quarterly interim financial statements, 2012–2026.
Full annual report with strategic review, 2012–2025.
Annual sustainability reporting since 2021.
History of corporate actions since the 1994 IPO.
Daily share price, shareholder structure, and capitalization.
Recorded history of dividend distribution.
Notices, materials, and results of the GMS, 2015–2026.
Information disclosures published by the company.